Infographics
This infographic illustrates the key demographics of people who entered into personal insolvency procedures using the concept of New Zealand as a village of 100 insolvent debtors.
The text description of the infographic is also available below.
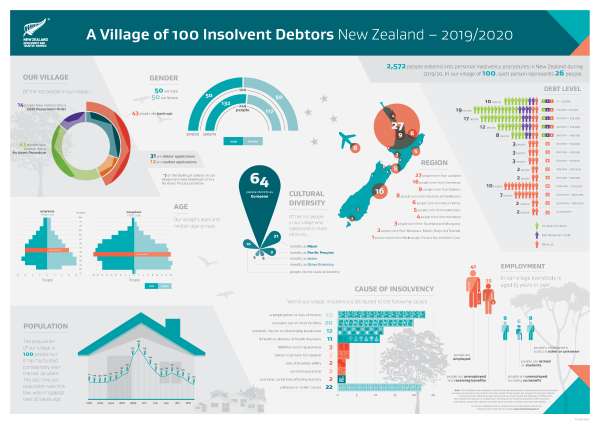
A Village of 100 Insolvent Debtors - New Zealand 2019 - 2020
Download the infographic
A4 version: A Village of 100 Insolvent Debtors - New Zealand 2019 - 2020 [PDF, 786 KB]
A2 version: A Village of 100 Insolvent Debtors - New Zealand 2019 - 2020 [PDF, 741 KB]
Our village
2,572 people entered into personal insolvency procedures in New Zealand during 2019/20. In our village of 100, each person represents 26 people.
Of the 100 people in our village:
- 14 people have entered into a Debt Repayment Order
- 43 have entered into a No Asset Procedure
- 43 people are bankrupt (31 are debtor application and 12 are creditor applications)
*7 of the bankrupt debtors in our village have been bankrupt or in a No Asset Procedure before.
In 2019/20 (100 people):
- 50 male
- 50 female
In 2009/10 (249 people):
- 132 male
- 117 female
The population of our village is 100 people but it has fluctuated considerably over the last 20 years. The last time our population was this low, was in 1996/97 over 20 years ago.
| Year | Population |
|---|---|
| 2000/01 | 111 |
| 2001/02 | 109 |
| 2002/03 | 108 |
| 2003/04 | 108 |
| 2004/05 | 116 |
| 2005/06 | 120 |
| 2006/07 | 139 |
| 2007/08 | 148 |
| 2008/09 | 219 |
| 2009/10 | 249 |
| 2010/11 | 218 |
| 2011/12 | 180 |
| 2012/13 | 154 |
| 2013/14 | 133 |
| 2014/15 | 136 |
| 2015/16 | 150 |
| 2016/17 | 137 |
| 2017/18 | 129 |
| 2018/19 | 112 |
| 2019/20 | 100 |
Where do the 100 people in our village come from:
| Region | Number of people |
|---|---|
| Auckland | 27 |
| Canterbury | 16 |
| Waikato | 9 |
| Wellington | 8 |
| Overseas | 8 |
| Bay of Plenty | 6 |
| Hawke's Bay | 5 |
| Northland | 4 |
| Whanganui | 3 |
| Southland | 3 |
| Manawatu | 2 |
| Nelson | 2 |
| Otago | 2 |
| Taranaki | 2 |
| Marlborough | 1 |
| Poverty Bay | 1 |
| West Coast | 1 |
Of the 100 people in our village who stated one or more ethnicity:
- 64 identify as European
- 21 identify as Maori
- 9 identify as Pacific Peoples
- 5 identify as Asian
- 5 identify as Other Ethnicity
- 10 people did not state an identity
Our village's ages and median age-groups:
2019/20
Median age group is 35-40 years.
| Age groups | Female | Male |
|---|---|---|
| 15-20 years | 0 | 0 |
| 20-25 years | 4 | 3 |
| 25-30 years | 8 | 6 |
| 30-35 years | 8 | 7 |
| 35-40 years | 7 | 6 |
| 40-45 years | 6 | 6 |
| 45-50 years | 5 | 6 |
| 50-55 years | 4 | 5 |
| 55-60 years | 3 | 4 |
| 60-65 years | 2 | 3 |
| 65-70 years | 1 | 2 |
| 70-75 years | 1 | 1 |
| 75-80 years | 1 | 1 |
2009/10
Median age group is 40-45 years.
| Age groups | Female | Male |
|---|---|---|
| 15-20 years | 1 | 1 |
| 20-25 years | 16 | 14 |
| 25-30 years | 17 | 14 |
| 30-35 years | 15 | 16 |
| 35-40 years | 16 | 18 |
| 40-45 years | 15 | 17 |
| 45-50 years | 14 | 16 |
| 50-55 years | 9 | 14 |
| 55-60 years | 7 | 10 |
| 60-65 years | 4 | 7 |
| 65-70 years | 2 | 3 |
| 70-75 years | 1 | 1 |
| 75-80 years | 0 | 1 |
Within our village, Insolvency is attributed to the following causes:
| Cause of insolvency | Number of people |
|---|---|
| Unemployment or loss of income | 23 |
| Excessive use of credit facilities | 20 |
| Domestic discord or relationship breakdown | 12 |
| Ill health or absence of health insurance | 11 |
| Liabilities due to guarantees | 3 |
| Failure to provide for taxation | 3 |
| Lack of business ability | 2 |
| Adverse legal action | 2 |
| Economic conditions affecting industry | 2 |
| Unknown or 'other' causes | 22 |
In our village everybody is aged 15 years or over.
- 41 people are employed
- 35 people are unemployed and reveiving benefits
- 9 people are unemployed receiving no benefit
- 6 people are retired or students
- 9 people's employment status is other or unknown
Our village's debt levels:
| Debt level | No asset procedure | Debt Repayment Order | Bankrupt | Total people |
|---|---|---|---|---|
| $1–$9,999 | 7 | 2 | 1 | 10 |
| $10,000–$19,999 | 13 | 4 | 2 | 19 |
| $20,000–$29,999 | 12 | 3 | 2 | 17 |
| $30,000–$39,999 | 7 | 3 | 2 | 12 |
| $40,000–$49,999 | 4 | 2 | 2 | 8 |
| $50,000–$59,999 | 3 | 3 | ||
| $60,000–$69,999 | 3 | 3 | ||
| $70,000–$79,999 | 3 | 3 | ||
| $80,000–$89,999 | 2 | 2 | ||
| $90,000–$99,999 | 2 | 2 | ||
| $100,000–$199,999 | 10 | 10 | ||
| $200,000–$499,999 | 7 | 7 | ||
| $500,000–$999,999 | 2 | 2 | ||
| $1,000,000+ | 2 | 2 |
Note
This infographic was developed to illustrate the key demographics of people who entered into personal insolvency procedures during 2019/20 using the concept of New Zealand as a village of 100 insolvent debtors.
This data has been obtained through various sources, predominantly the Statement of Affairs form which debtors are required to complete upon entering into an insolvency procedure. Other sources of information include public registers and information provided by creditors and other third parties.
For further comparative data on previous financial years please refer to our statistics webpages.