Statistics
Recent insolvency statistics
Insolvency procedures
For the month of June 2026
| Bankruptcies | No Asset Procedure applications (NAP) | Debt Repayment Order applications (DRO) | Liquidations |
|---|---|---|---|
| 49 | 42 | 9 | 50 |
Personal insolvency comparisons
Year ended 30 June 2026
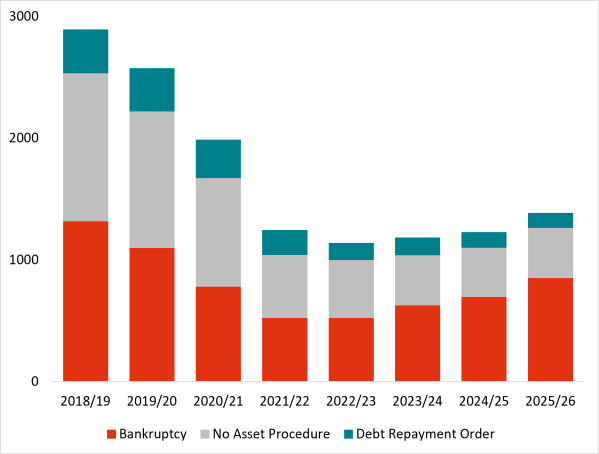
| Procedure | 2018/19 | 2019/20 | 2020/21 | 2021/22 | 2022/23 | 2023/24 | 2024/25 | 2025/26 |
|---|---|---|---|---|---|---|---|---|
| Bankruptcy | 1,319 | 1,101 | 782 | 525 | 526 | 628 | 698 | 859 |
| No Asset Procedure | 1,218 | 1,121 | 894 | 519 | 476 | 413 | 405 | 411 |
| Debt Repayment Order | 353 | 349 | 307 | 197 | 132 | 138 | 120 | 117 |
| Totals | 2,890 | 2,571 | 1,983 | 1,241 | 1,134 | 1,179 | 1,223 | 1387 |
Liquidation figures
Year ended 30 June 2026
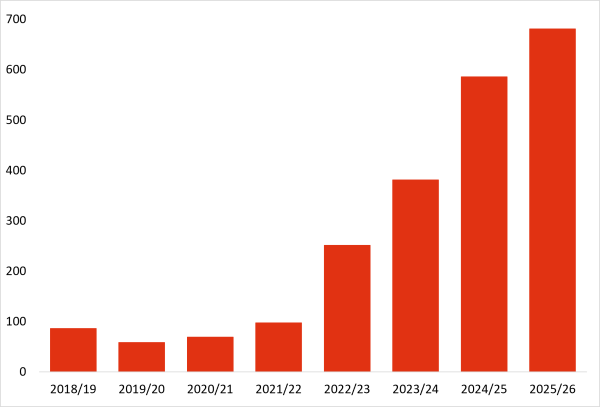
| 2018/19 | 2019/20 | 2020/21 | 2021/22 | 2022/23 | 2023/24 | 2024/25 | 2025/26 |
|---|---|---|---|---|---|---|---|
| 86 | 58 | 69 | 97 | 251 | 381 | 586 | 681 |
Insolvency procedure statistics
Recent, and historical statistics on bankruptcies, Debt Repayment Orders (formerly Summary Instalment Order) and No Asset Procedures.
Corporate insolvency statistics
Recent and historical liquidation statistics.
Proceeds of Crime statistics
Cumulative totals of Proceeds of Crime matters handled by the Official Assignee.
Annual figures for new estates since 1988
Annual totals of bankruptcies, liquidations, Debt Repayment Orders (formerly Summary Instalment Order) and No Asset Procedures since 1988.